IJHCS 2026 | Men and Women Use AI at Similar Rates — Why Does the Gap Persist?
In two U.S. survey waves, the share of men and women who had ever used an LLM converged, yet frequency of use and self-rated proficiency still differed. Using more often is not the same as being more skilled — and not using is not necessarily falling behind. After diffusion, ask which tasks people keep the tool in.

Having AI draft one email and rarely opening it again; handing research and sentence edits to it several times a week. If you only ask whether people have used AI, both answers are yes. How large a place it occupies in daily life is clearly not the same thing.
A U.S. survey asked 1,495 people in 2023 and followed 970 of them in 2025. The share reporting having used a large language model rose from about 42% to 82%, and the overall adoption gap between men and women narrowed. Stopping there, it is easy to think the difference has already passed.
Keep reading, though, and use frequency and self-rated proficiency still differ. Adoption rates converging is not the same as everyday use converging. Tried once, use often, and feel skilled are three different questions. The last also needs care: this is not an ability test.
01 Asking only whether people have used misses the second half
Authors recruited U.S. adults via Prolific in April 2023 with age, gender, and ethnicity quotas; after excluding invalid data they analyzed 1,495 responses. In January 2025 they invited the original participants again; 970 returned — about 65% retention. Nearly two years separated the waves.
As Figure 1 shows, middle connecting lines display use status from 2023 to 2025. No → Yes means previously unused, later reporting use; NA means no wave-2 data — it cannot be counted as still non-users. The flows remind readers better than two overall percentage bars: some people changed status; others were lost to follow-up.
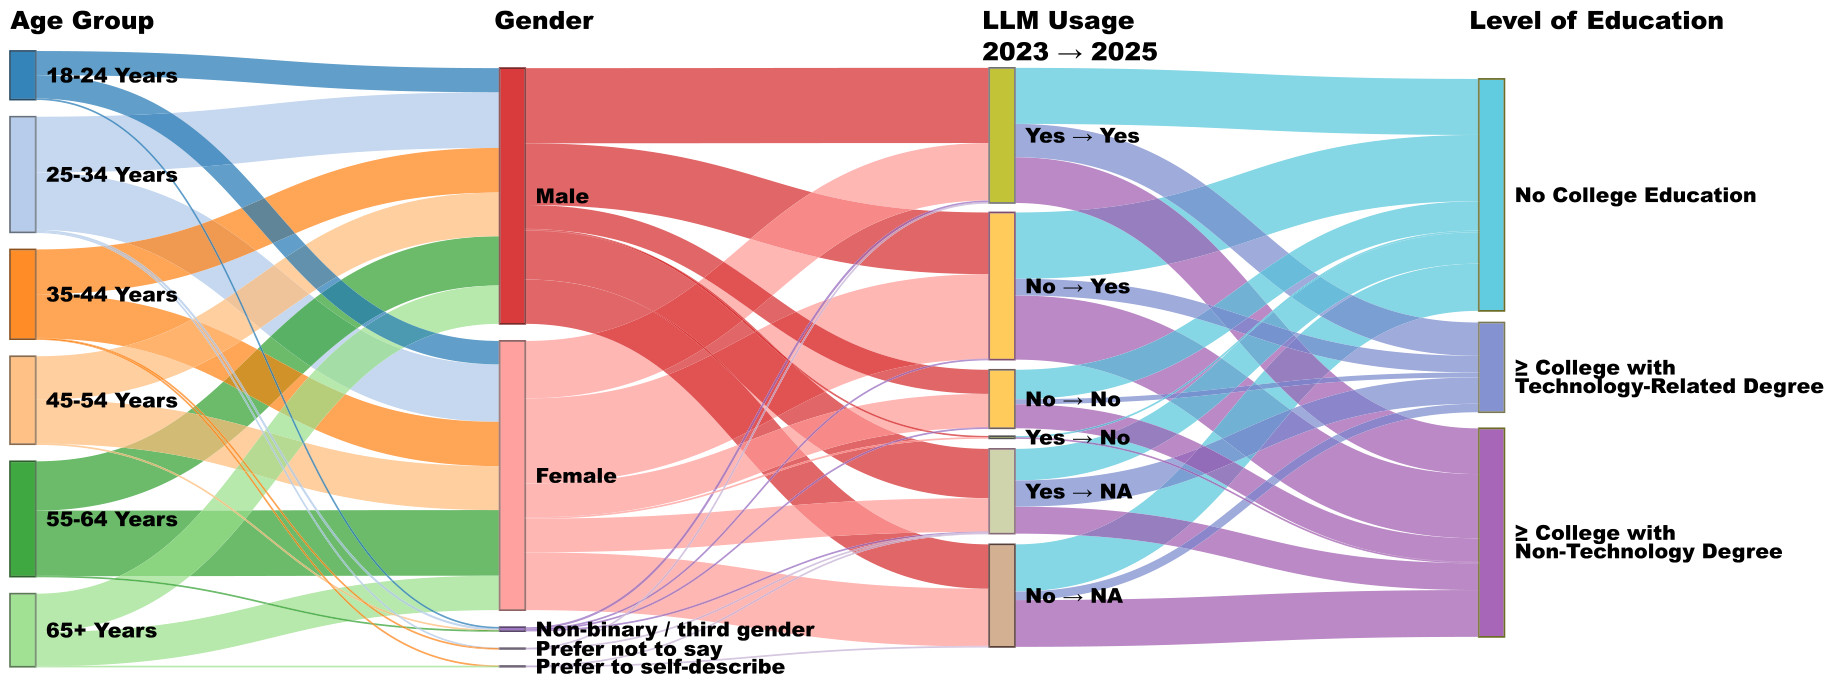
The questionnaire also asked more than ChatGPT. Authors first introduced large language models (LLMs), gave examples such as ChatGPT, Bing, and Bard, then asked whether people had ever used them. Those who had continued with frequency, proficiency, and uses; non-users explained reasons.
This is not a national random sample, though. People willing to take platform surveys may encounter new technology more often, and follow-up lost about 35% of the sample. The 82% describes answers from 2025 returnees — not U.S. population prevalence, and not today’s usage rate. Age-group change also includes natural cohort aging across two years; not all of it is attrition.
It also did not log which tools people actually opened or how many tasks they handled. We see answers at two time points, not a complete use history in between. Across those years model capability, media discussion, and tool integration all changed — growth cannot all be credited to one product or one campaign.
02 The entry gap narrowed — the frequent-use gap remains
In 2023, 34.3% of women and 49.1% of men reported having used an LLM — a 14.8 percentage-point gap. By 2025 the groups were 80.0% and 84.5%. Authors’ Bayesian model no longer judged the overall gender difference in adoption as meaningful, and the descriptive gap did narrow.
Ask a different question and difference reappears. Among people who had already used an LLM, the share using more than once a month was 72.0% for men and 56.1% for women in 2023; in 2025, 77.1% and 67.2%. That is not daily use rate, nor a share of all respondents.
As Figure 2 shows, frequency distributions for both waves are arranged by age and by men/women. Light to dark runs from lower to higher frequency; when reading, note that the lightest shade still includes users at about once a month or less. The same “have used” answer can mean an occasional try or repeated use.
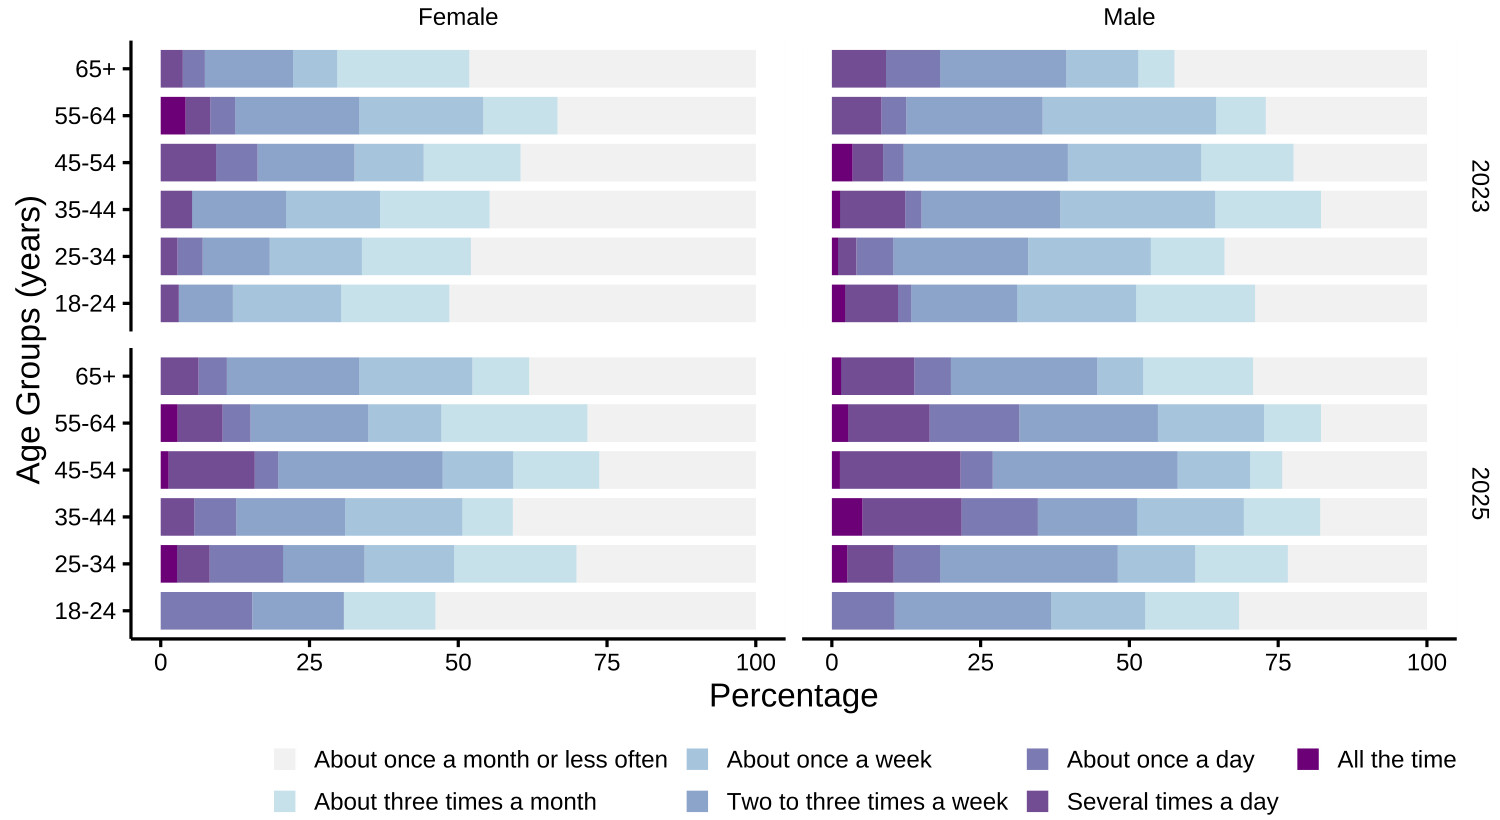
If a product only counts new users, the second layer of difference stays invisible. Successfully registering and trying a few prompts does not guarantee later return. Authors did not measure retention for a particular product, but these frequency results invite another question: after trying, which tasks do people keep the tool in?
Overall closeness also does not cover every age group. In 2025 the 25–34 group still showed about a 15 percentage-point gender gap in adoption. Because samples for other genders were small, gender regressions compared only self-reported men and women and cannot extrapolate to all gender groups. Using more often also does not mean being more skilled or benefiting more.
03 Young people try first — that does not mean they keep using more
Age results are likewise not a straight line. In 2023 about 58% of 18–24-year-olds reported use versus about 29% of those 65+; in 2025 the groups approached 89% and 72%. Younger people encountered tools earlier; older groups also rose clearly — adoption gaps narrowed but did not vanish in every comparison.
Among 2025 users, though, the 45–54 group’s frequency exceeded both 18–24 and 65+; 35–44 also exceeded 18–24. That suggests trying a new tool earlier and later using it a lot are not the same ranking.
As Figure 3 shows, the 2023 upper half compares adoption by age; the lower half looks only at respondents with university-level education, distinguishing technology-related majors. Numbers are within-group shares — not men’s or women’s share of all users. For readability, the original figure’s two columns are split here.
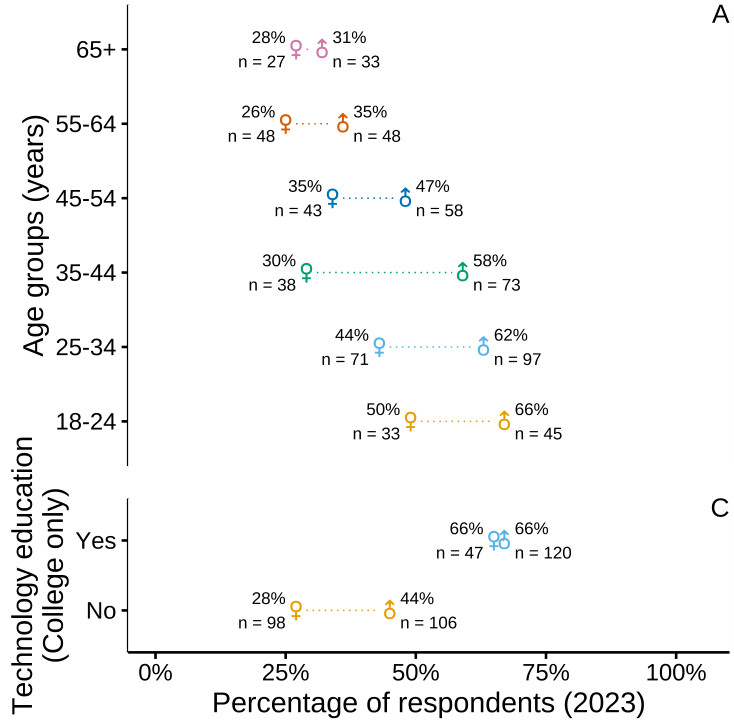
Look at the lower half: among people with technology education, men and women both adopted at about 66% in 2023; among those without, women about 28% and men about 44%. As Figure 4 shows, by 2025 those with technology backgrounds were about 91% overall and those without about 83% — that gap also shrank.
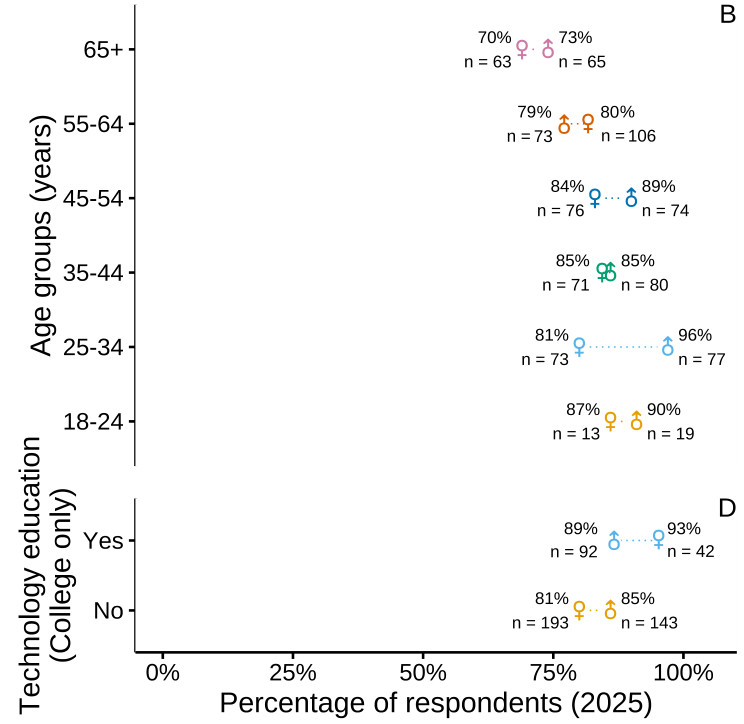
Seeing both groups at 66%, do not rush to say technology education eliminated gender barriers. Authors did not randomly assign training; major choice may jointly relate to career, interest, and opportunity to use. Do heavier work tasks make midlife adults use more? The account is plausible — it was not separately measured in this study.
These cross-tabs at least make fixed user personas by age or gender look doubtful. Within one age band, some may need research every day; others may lack related tasks. Judging which opportunities matter still requires asking about tasks and use context together.
04 Feeling skilled is not proof of ability
Proficiency comes from LLM users choosing a rung for themselves. The questionnaire used five levels from Novice to Expert. Across waves, self-rated novices fell from about 39% to 22%; those rating themselves Competent rose from about 29% to 39%. Users overall felt more familiar with such tools.
As Figure 5 shows, men in both waves tended toward higher rungs; women had a higher share of self-rated novices. The five colors are self-evaluation, not five exam scores. The study did not arrange true/false judgment tests, prompt tasks, or real work-output measures.
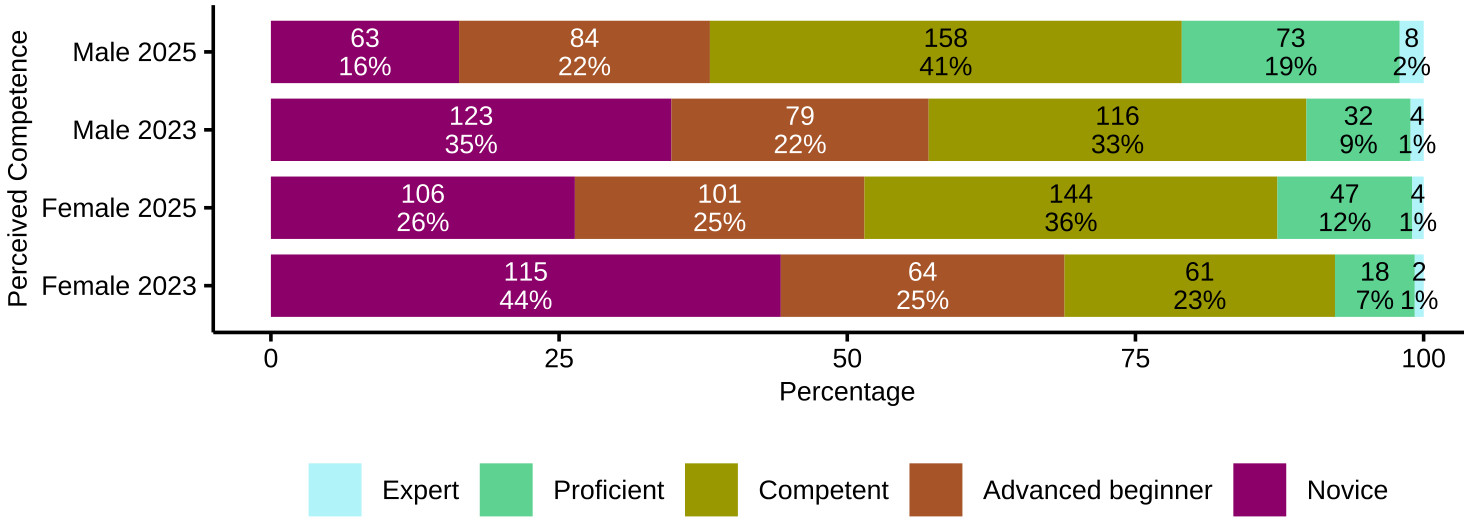
People equally able to finish a task may hold different standards for “skilled.” Authors discuss possible gendered self-rating effects but did not compare scores under equal performance in this study. So one cannot say self-rating differences prove ability gaps — nor assert the reverse, that differences are all confidence.
I think this step is easiest to distort in circulation. Men use more and feel more confident, rewritten as men are better at using it — almost only a few words change, but the measured object swaps. Questionnaires can find people who feel unfamiliar; arranging training still requires seeing where they actually stick on real tasks.
05 Research and editing begin to take over from try-it-out novelty
Use questions let people write free answers; authors then categorized. Mentions of looking up information rose from 31.9% to 42.4%; editing/revision from 3.7% to 12.8%; mere try-it-out fell from 11.7% to 4.3%; entertainment from 8.9% to 3.1%. From these answers, some uses gradually move toward everyday tasks.
Not every work use surged, though. Formal text generation was nearly flat, 27.2% to 27.4%. And these shares are the share of respondents who mentioned a use category — not duration, task volume, or success rate; one answer can fall in multiple categories and cannot be summed to 100%.
In 2023, participant U23338 used it for Etsy product descriptions; U2334 summarized articles and scientific research; in 2025, U25647 rewrote work emails; U25629 organized thoughts. Reading those answers shows a few tasks at hand. What several participants describe is one step inside existing work.
Authors also pooled both waves for exploratory comparison, merging Competent, Proficient, and Expert self-ratings versus Novice. The former group more often mentioned looking up information, writing formal text, and programming; the latter more often mentioned trying out or entertainment. Direction is still unclear: tasks may make people familiar with tools, or people who feel skilled may be more willing to use them for tasks.
If the goal is reducing try-and-leave, these concrete tasks are more worth studying than a blank chat box. For example, build entries around email revision or source checking and observe whether they help people finish tasks. Authors propose task support and progressive guidance — this questionnaire did not test their effects.
06 People who do not use AI may not need to be chased up
Non-user answers remind that diffusion is not only a catch-up class. Valid non-user reason answers were 850 and 167 across waves. Mentions of no need or interest rose from 26.6% to 38.9%; preference for writing and thinking oneself from 8.3% to 15.0%; ethics and value concerns from 6.7% to 12.0%.
The denominator already shrank sharply, and composition changed. It cannot show that society’s AI refusers are growing; people with concerns also may not write every concern into an open answer. N25129 likes writing and revising letters and stories; N25119 distrusts AI companies. Not every non-user lacks knowledge.
Giving these people the same prompt tutorial may not even ask the right question. Some need examples; some have not found related tasks; some care who receives the content and how it will be used later. Tutorials can teach operations — they cannot decide for people whether those concerns are worth accepting.
Further research might log tasks, operations, and outcomes. Whether a revision saved rework, whether citations can be checked, when users decide not to use — those need logs and task evaluation. This paper did not measure productivity, income, or objective ability; group frequency differences cannot yet be called benefit gaps.
I am reluctant to treat “more and more people have tried” as the endpoint of this kind of research. Whether people can judge when to use, how far to go, and when to stop is more worth checking than simply raising counts. That is a reminder from a platform sample followed with about 65% retention — it still needs broader populations and real tasks to test.
Paper informationOriginal title: Early and late adoption and appropriation of LLMs differs by gender, age, and technology education
Authors: Fiona Draxler (corresponding author, University of Mannheim), Daniel Buschek (University of Bayreuth), Mikke Tavast, Juhi Kulshrestha, Robin Welsch (latter three from Aalto University).
Published in International Journal of Human–Computer Studies, online 14 August 2026, assigned to 2027 volume 217, article 103922. Link: https://doi.org/10.1016/j.ijhcs.2026.103922
Key termsAdoption: this questionnaire measures whether people have ever used an LLM. Appropriation: people gradually put tools into their own tasks and everyday practices — this paper observes it from frequency and use answers, without directly measuring the full process.
Self-rated proficiency: respondents’ judgment of themselves, not objective test scores. Bayesian regression: estimates differences and uncertainty from sample and priors; authors’ p_b is the posterior share opposite the median direction or zero — not a conventional significance-test p-value.
ReferencesDraxler, F., Buschek, D., Tavast, M., Kulshrestha, J., & Welsch, R. (2027). Early and late adoption and appropriation of LLMs differs by gender, age, and technology education. International Journal of Human–Computer Studies, 217, 103922. https://doi.org/10.1016/j.ijhcs.2026.103922